2.2 Diffraction Effects
When light passes through a small aperture, i.e. an aperture whose size if comparable to the
wavelength of light, the wave nature of light causes interference effects that result in perceivable image
quality loss. Images become more blurred due to the increasing support of the resulting point spread
function of the optical system. An immediate consequence is that we cannot indefinitely gain
depth of focus by reducing the aperture of the optical system as Equation TM:2.22 would
suggest.
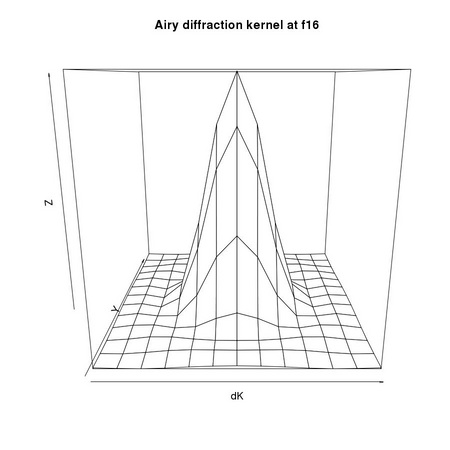
The following code snippet simulates the effect of diffraction with data corresponding to a high
resolution digital compact camera, assuming a default wavelength of 550e- 9m: diffraction is modeled
by convolution with an appropriate kernel
1 A <- ia.get(i_orthoRed, animask(0,0,1201,256)) 2 # 3 # dK represents the points spread function of the 4 # optical system (and corresponds to the Aity function) 5 # 6 dK <- tm.diffractionKernel(focalLength= 8.9e-3, 7 ... fStop= 16, 8 ... pixelSize= (8.8/3264)/1000) 9 tm.plot("figures/diffractionKernelF16", 10 ... persp(dK, main = "Airy diffraction kernel at f16")) 11 # 12 # In order to better appreciate the shape of the kernel we 13 # can oversample it: dK3 can then not be used to simulate 14 # the effect (as it corresponds to 3x oversmoothing) 15 # 16 dK3 <- tm.diffractionKernel(focalLength= 8.9e-3, 17 ... fStop= 16, 18 ... pixelSize= (8.8/3264)/1000, 19 ... superSampling=3) 20 tm.plot("figures/diffractionKernelF163x", 21 ... persp(dK3, main = "Airy diffraction kernel at f16 (3x supersampled)")) 22 # 23 # We generate the diffracted image 24 # 25 B <- ia.convolution(A, dK) 26 tm.plot("figures/diffractionEffect", 27 ... ia.show(B, main="Diffraction at f16")) 28 # 29 # and have a detailed look at an intermediate row 30 # 31 tm.plot("figures/diffractionDetail", 32 ... matplot(cbind(A@data[126,],B@data[126,]), 33 ... type="l",col=c("black"), pch = 2:3, lty=1:2, xlab="x", 34 ... ylab="", main="W(/o) Diffraction"), 35 ... legend(0,150, c("No diffraction", "Diffraction"), 36 ... lty=1:2, col=c("black")), 37 ... height=3)